









Market Indicators
Mortgage rates, monthly figures by area and home price trends —
always with the official source and date.
30-year mortgage rate
Freddie Mac® · weekly national averageFlorida single-family median price
Florida Realtors® · September 2026Miami-Dade single-family median price
MIAMI REALTORS® · September 2026of foreign buyers chose Florida
NATIONAL ASSOCIATION OF REALTORS® · 2026 reportFlorida Real Estate Data with Official Sources
This page brings together public data from Freddie Mac®, Florida Realtors®, MIAMI REALTORS®, the U.S. Federal Housing Finance Agency (FHFA) and the Federal Reserve. Figures are shown exactly as published, with their date and a link to the original.
Monthly figures: September 2026
Next official release: November 16, 2026
See where the data comes from ↓
Weekly Mortgage Rates
National averages for 30-year and 15-year fixed-rate mortgages, published every Thursday by Freddie Mac®, with the trend of the last 52 weeks.
Monthly Figures by Area
Median prices and closed sales for single-family homes and condos, copied from the official monthly releases. Each card shows its source and publication date.
South Florida County Snapshot · September 2026
Closed sales, median sale price, share of cash purchases and months of inventory, by county and property type, compared with September 2025.
| County | Single-family homes | Condos / Townhouses | ||||||
|---|---|---|---|---|---|---|---|---|
| Closed sales | Median price | Cash | Months of supply | Closed sales | Median price | Cash | Months of supply | |
| Miami-Dade | 824 (-4.7%) | $692,000 (+4.1%) | 26.2% | 5.1 | 909 (+0.6%) | $417,090 (-0.7%) | 49.4% | 12.3 |
| Broward | 974 (-7.1%) | $641,500 (+2.4%) | 24.9% | 4.2 | 851 (-12.5%) | $235,000 (-14.5%) | 54.8% | 10.2 |
| Palm Beach | 1,132 (-2.7%) | $656,000 (+6.7%) | 44.7% | 3.6 | 782 (-4.3%) | $310,000 (+3.3%) | 61.1% | 6.8 |
| Martin | 168 (-4.0%) | $600,000 (+5.3%) | 33.3% | 3.6 | 90 (+13.9%) | $237,500 (+8.0%) | 58.9% | 5.1 |
| St. Lucie | 464 (-8.7%) | $395,000 (-1.3%) | 27.6% | 5.2 | 91 (-3.2%) | $337,500 (+24.1%) | 42.9% | 7.8 |
Source: MIAMI REALTORS®, South Florida Market Stats (Southeast Florida MLS data). Change vs. September 2025 in parentheses. See the official figures
Home Price Index by Area
One-year and one-quarter change of the FHFA House Price Index for each Florida area we follow.
Federal Reserve Decisions

Florida News by Area
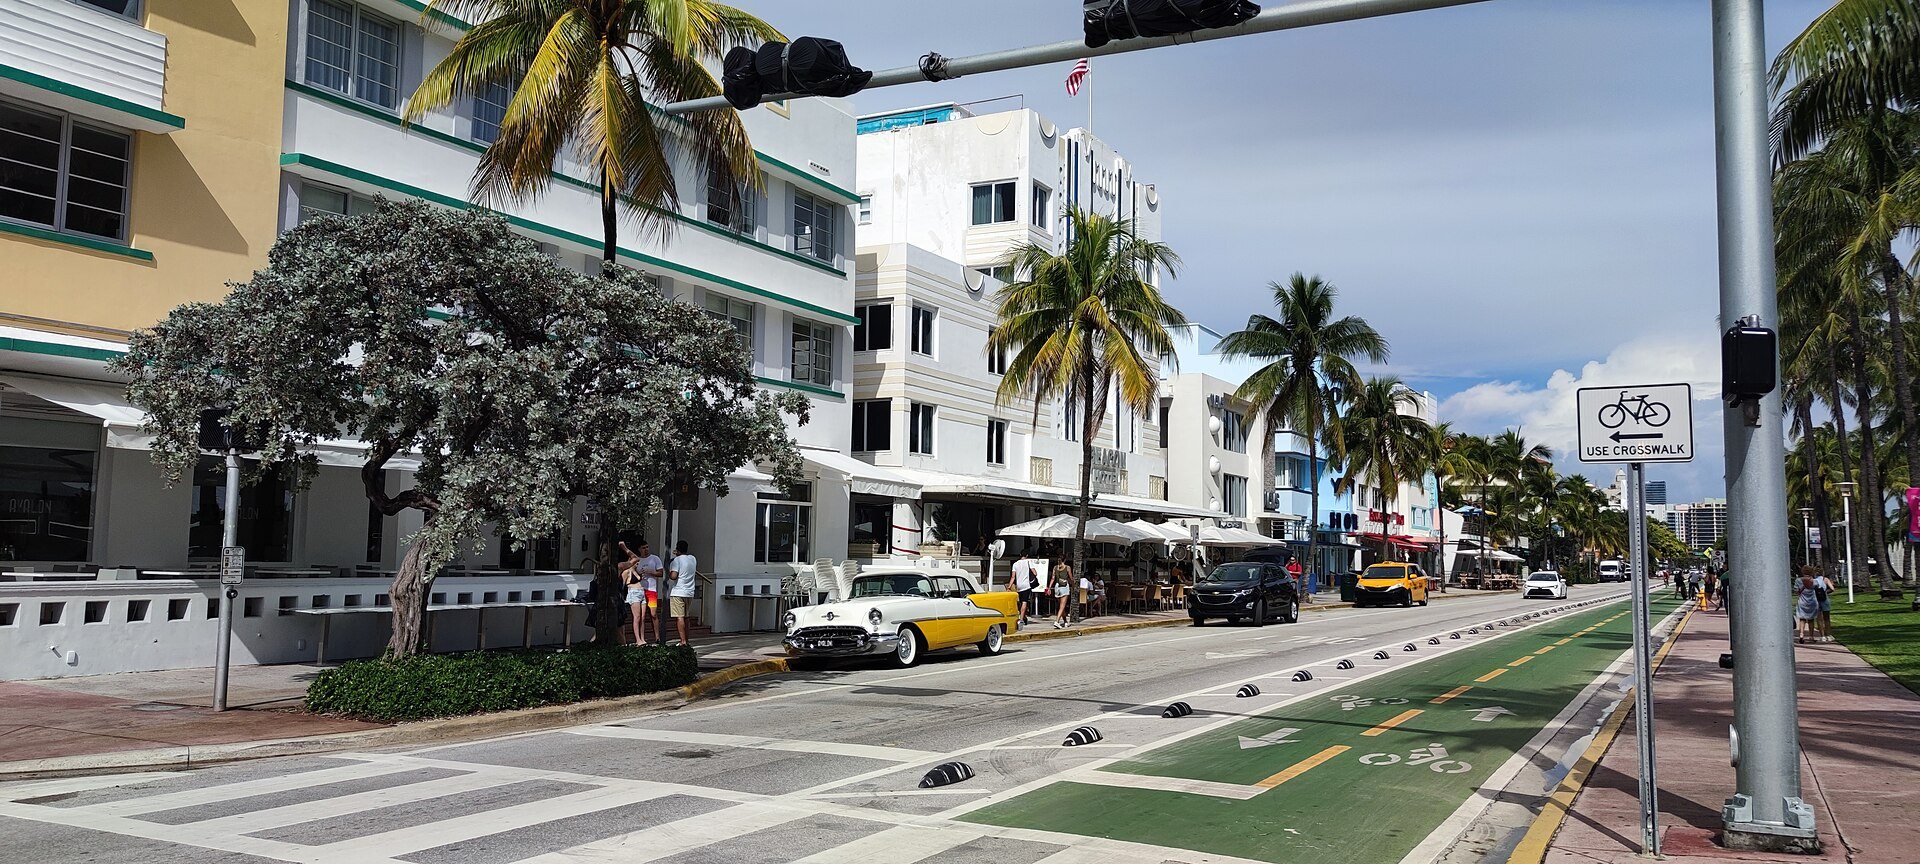 NewsMiami-Dade

 NewsTampa · Fort Myers · Naples
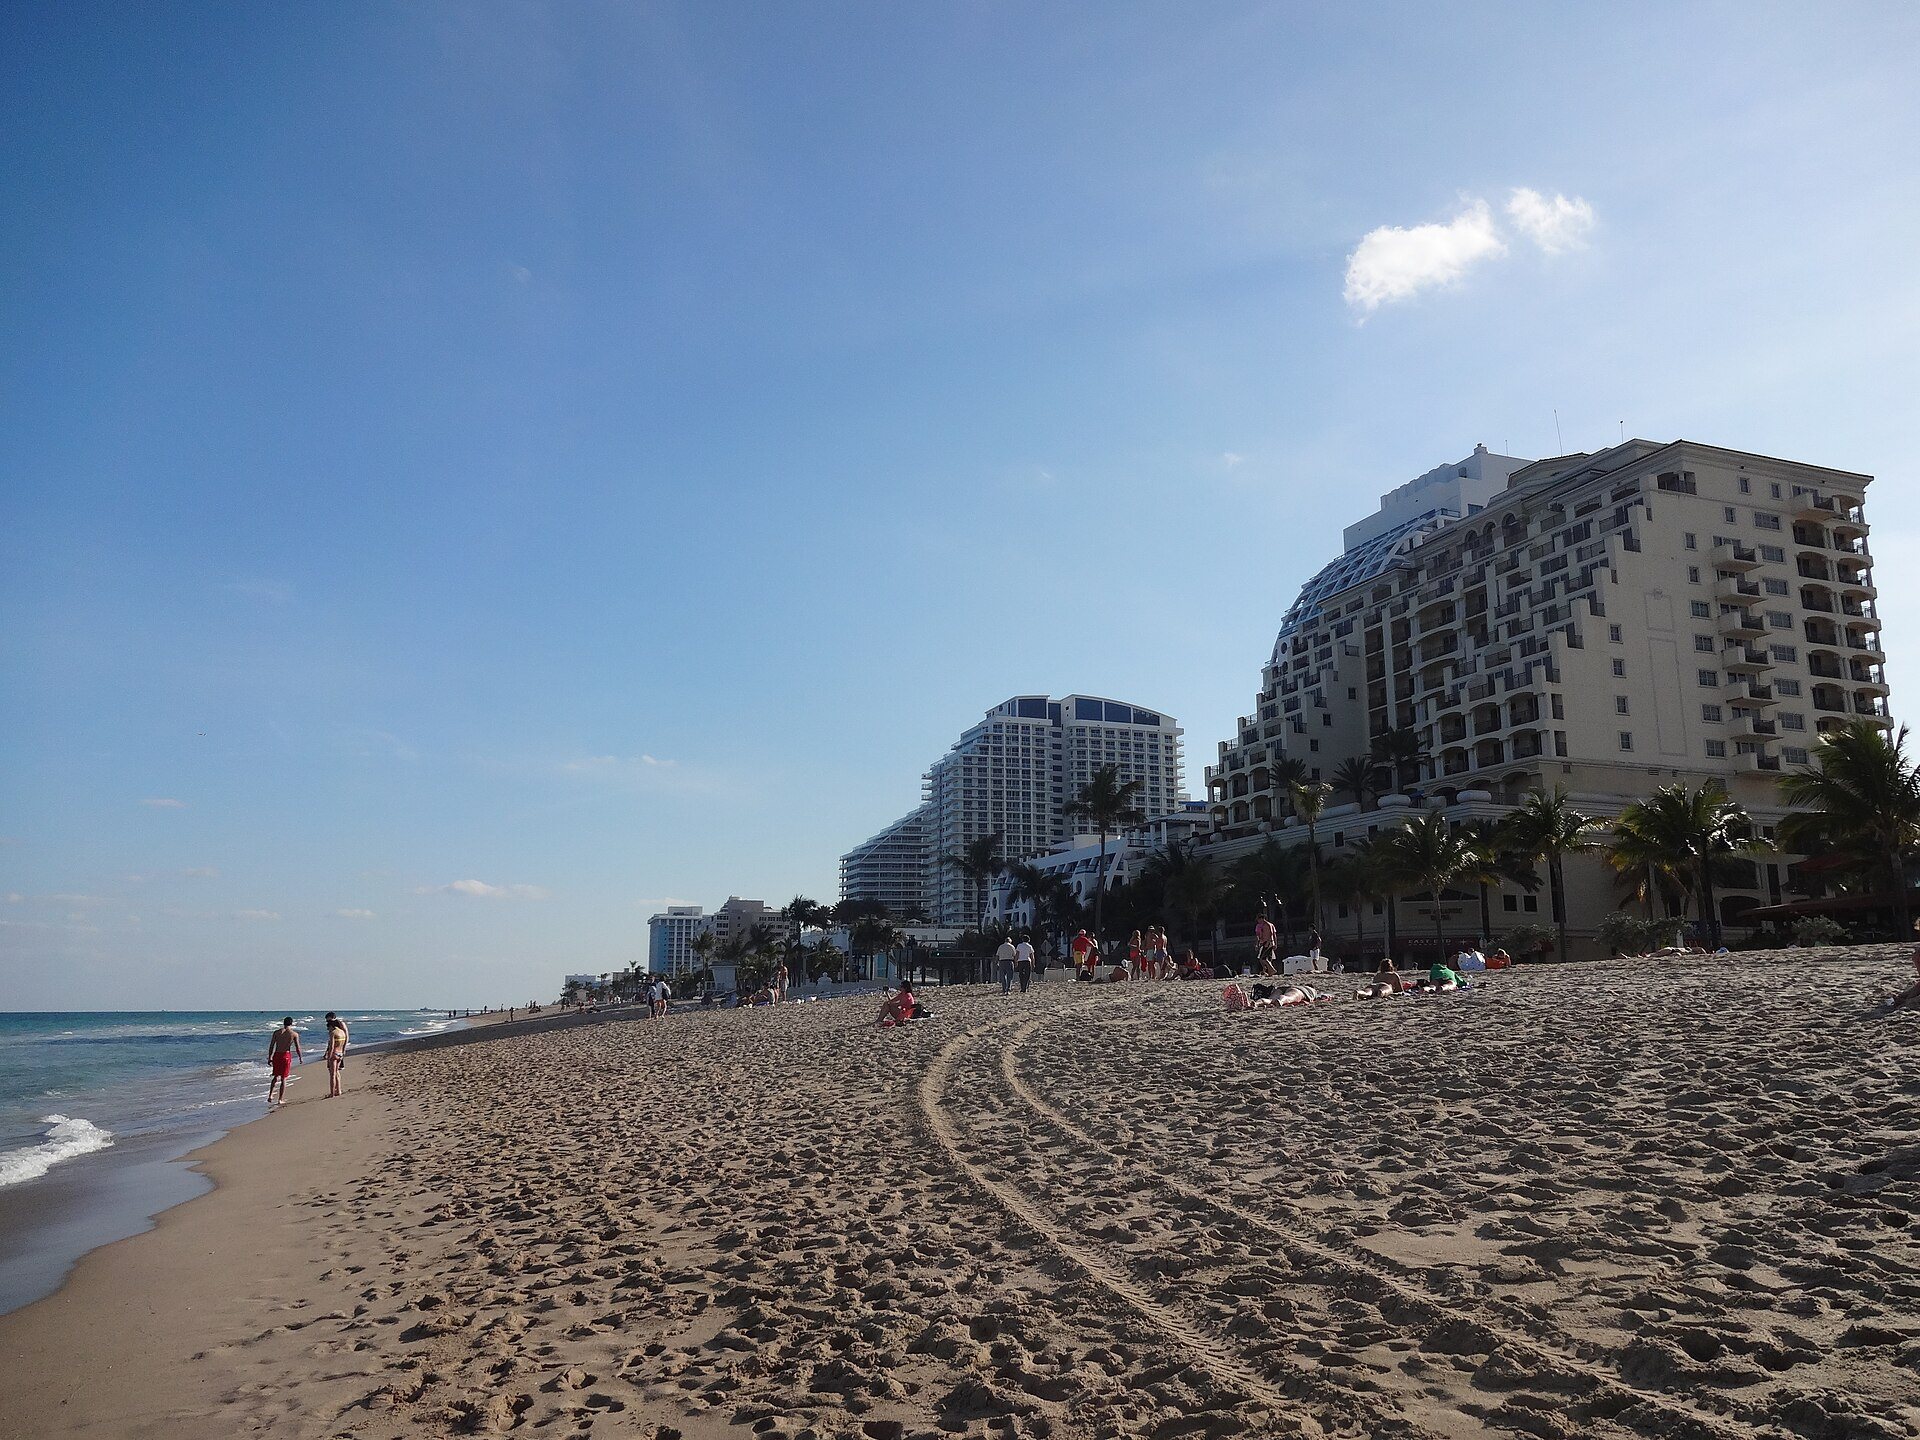

Fair Housing & Equal Housing Opportunity
Carlos Prieto D. and EPIC Choice Realty are committed to the letter and spirit of U.S. policy for the achievement of equal housing opportunity throughout the Nation. The federal Fair Housing Act prohibits discrimination in the sale, rental and financing of housing because of race, color, religion, sex, national origin, familial status or disability.
Third-party content. Headlines, figures and reports on this page belong to their respective sources (Florida Realtors®, MIAMI REALTORS®, NATIONAL ASSOCIATION OF REALTORS®, Freddie Mac®, FHFA, Federal Reserve). They are shown with attribution and a link to the original, without alteration, and are not the opinion, analysis or recommendation of Carlos Prieto D.
Photos: Wikimedia Commons — public domain / CC0. Credits